Carbon Brief: 74% of New U.S. Solar Capacity Installed in Republican States
The economic logic of clean energy is outpacing federal regulatory uncertainty, with Texas leading the national renewable expansion.
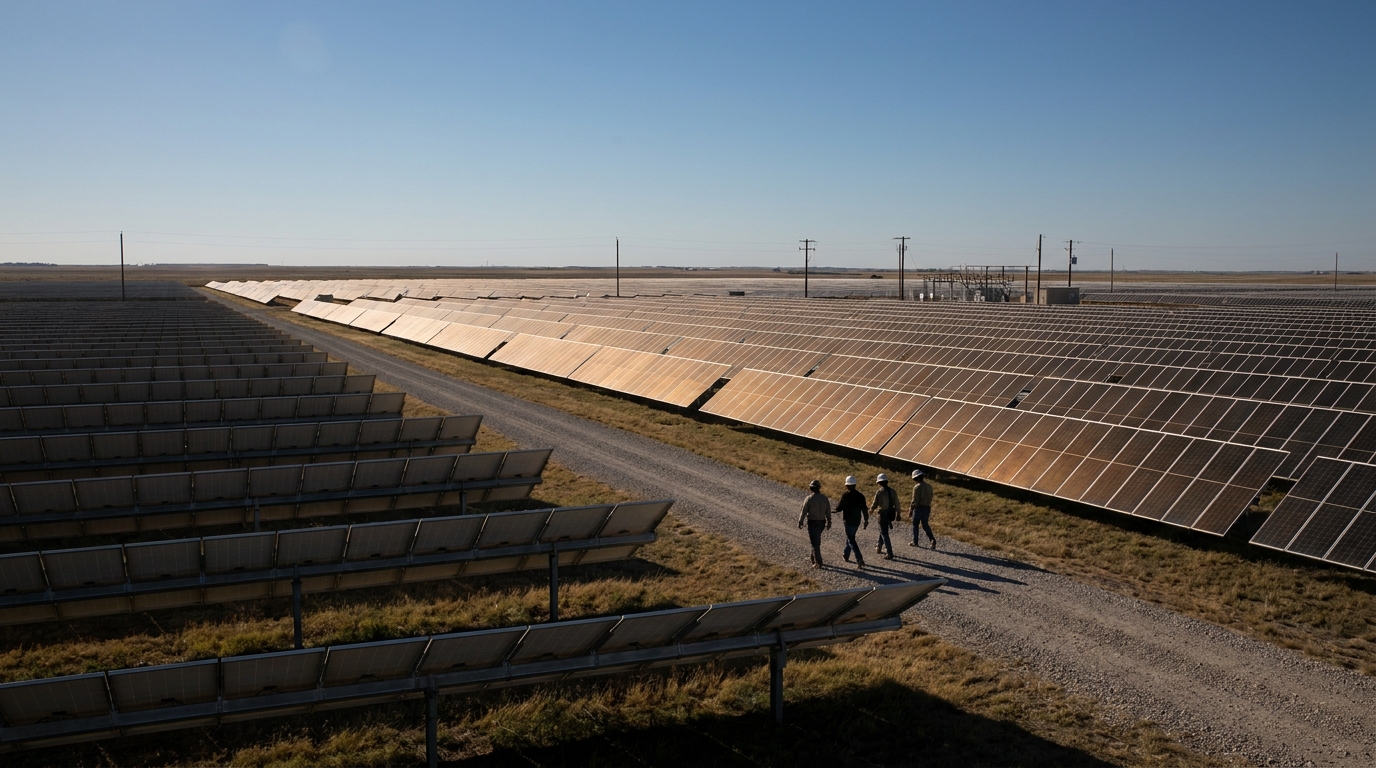
74% of new solar capacity installed in the United States during the first quarter of 2026 was located in states that voted for Donald Trump in 2024, according to an analysis by the Center for Global Sustainability at the University of Maryland published by Carbon Brief on June 25. Economic logic is outpacing federal political uncertainty as the primary driver of America's energy transition.
The analysis documents that solar, wind, and battery storage accounted for more than 90% of new electricity generation capacity added in the U.S. in both 2024 (47 gigawatts) and 2025 (48 GW), according to data from the EIA (U.S. Energy Information Administration). In May 2026, solar generation surpassed coal for the first time in the monthly electricity mix, with a 12.8% share versus 12.2%. Texas, a Republican state with no decarbonization mandate, leads national renewable expansion with approximately 90 GW of installed capacity and accounts for 40% of new utility-scale solar capacity projected for 2026, per the EIA. The finding carries direct relevance for Latin America: in Mexico, the levelized cost of electricity (LCOE) advantage of solar and wind is sustaining investment even in contexts of regulatory uncertainty.
The EIA projects 86 GW of new utility-scale generation capacity will be added in the U.S. in 2026, a record: 43.4 GW solar (51%), 24 GW battery storage (28%), and 11.8 GW wind (14%). Utility-scale solar generation is set to grow from 290 billion kilowatt-hours in 2025 to 424 billion in 2027, a 46% increase. Renewable costs have fallen steadily on manufacturing improvements and economies of scale, while a new 1 GW combined-cycle natural gas plant now costs approximately $2.4 billion, triple the 2022 price, with turbine wait lists stretching up to seven years. U.S. electricity demand grew 7% between 2020 and 2025, driven by data centers and electrification, and is projected to increase 24% to 34% over the next decade.
Federal fiscal changes do affect the pace of renewable deployment: the OBBBA Act of July 2025 accelerated the phase-out of solar and wind tax credits (ITC/PTC), with the full benefit expiring on July 4, 2026, for projects that have not yet broken ground. For Mexico and the broader region, the lesson is twofold: competitive renewable capex sustains investment despite political uncertainty, but fiscal deadlines define the speed of deployment.
This article was drafted with artificial intelligence assistance from verified sources and reviewed by a human editor before publication.
Sources
Related stories
This article was drafted with AI assistance from verified sources and reviewed by a human editor before publication.